09/03/2023

Dutch housing and mortgage market Q4 2022

Sjoerd van Dijck
Sjoerd van Dijck
Investor Relations
Sjoerd van Dijck

The end of Q4 also marks the end of a tumultuous year for the Dutch housing and mortgage market. High inflation, feeding into rising interest rates, and increased economic uncertainty had a significant effect on the housing and mortgage market. Nevertheless, 190 thousand home sales were registered and more than 150 billion euros in new mortgages were originated in 2022.

Although it is difficult to forecast exactly what 2023 will bring, we expect high mortgage rates to persist. The higher rates continue to have an impact on affordability which in turn affects borrowing capacity and hence house prices. Rising household income and persisting housing shortage will however absorb some of the downward pressure. In terms of new mortgage origination, the market is expected to be significantly smaller than in 2022, which is largely due to the departure of refinancers.


Main developments

Whereas energy prices initially fuelled inflationary pressure, they fell by the end of 2022. However, as the higher price of energy seeped through to commodity and food prices, the purchasing power of households is likely to remain under pressure. In particular, as the rise of commodity and food prices are stickier than the cost of energy.

As inflation remains well above the inflation target of 2%, the European Central Bank (ECB) is likely to maintain its tight monetary policy in its attempt to slow down the economy and control inflation.

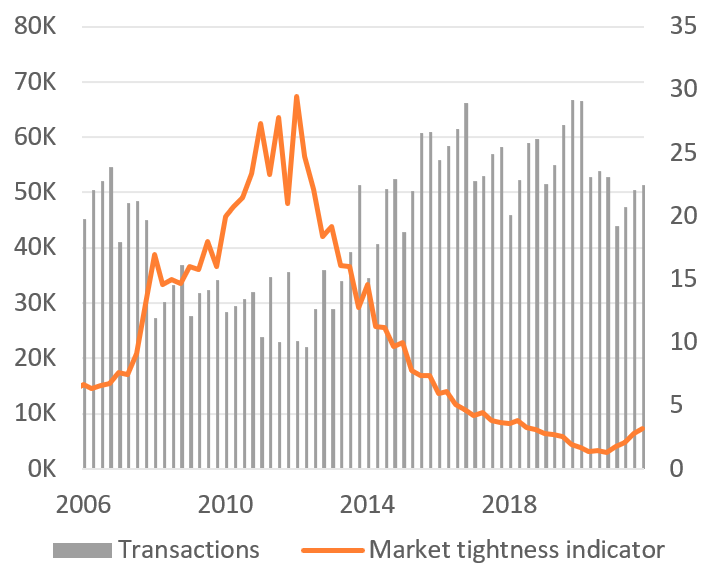
Economic uncertainty and higher interest rates continue to affect the Dutch housing market. Sellers are more concerned with the timing of their sale while buyers are becoming more cautious, causing fewer viewings, fewer bids and a decline in the number and amount of overbids. As a consequence, the number of transactions fell, while the number of houses for sale grew, thereby pushing down house prices. Despite the deteriorated dynamics in supply and demand, the housing market performed very well with more than 190,000 transactions in 2022.

Refinancers caused a peak in mortgage applications at the beginning of the year but with increasing mortgage rates the incentive to refinance disappeared, leading to a full withdrawal of refinancers from the market. At the same time, existing borrowers decided to start using their mover option, which allows porting their current mortgage conditions to a new house. As a result, mortgage clients are inclined to stay with their current mortgage provider and will not enter the market at all.

Despite the gradual decline in applications due to the disappearance of refinancers, there were still more than 520 thousand registered mortgage applications in 2022, enabling the mortgage market to reach a total volume of over 154 billion euros, which is very high from a historical perspective.

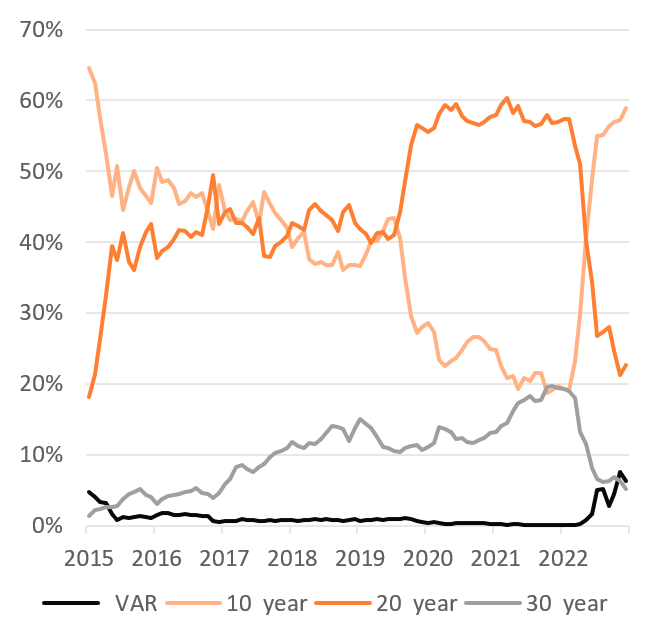
The increased interest rates also resulted in a shift in consumer preference from longer- to shorter fixed-interest periods. The magnitude of this shift is particularly visible when comparing the situation to 2021 when almost 80% of the mortgage applications had a fixed rate period of 20 years or longer. The situation at the end of 2022 is markedly different, as the share of mortgage applications with a fixed rate period of 20 years or longer has declined to 30% while the market share of 10 years or shorter increased to 70%.

So far, the weakened financial situation of households has not translated into payment problems for existing mortgage borrowers. This can be explained by the conservative Dutch lending standards, ensuring an adequate income buffer for households to cover unexpected shortfalls or extra costs. In addition to these standards, the Dutch labour market remains very tight, thereby providing financial security for households.

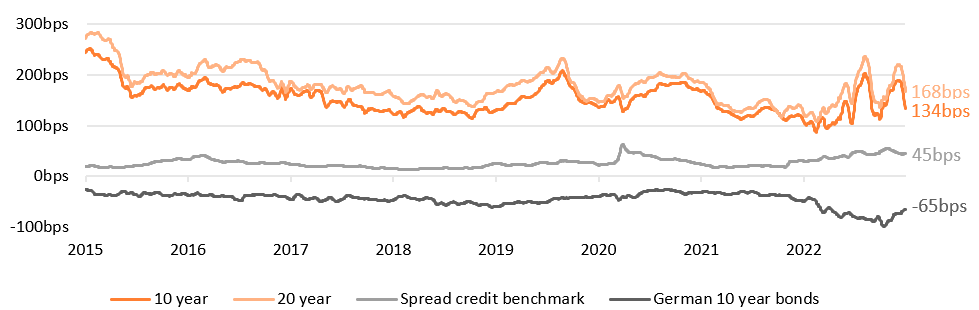
In line with the turmoil in the financial markets, spreads on Dutch mortgages were highly volatile. Despite that, Dutch mortgages remained an attractive asset class given the continued strong credit performance and the relatively high spreads compared to other long-term fixed-rate assets.


Outlook for 2023

2023 commenced with reports of declining inflationary pressures as energy prices continued to fall in January. Nevertheless, commodity and food prices increased as the higher energy costs already seeped through production costs in several sectors.

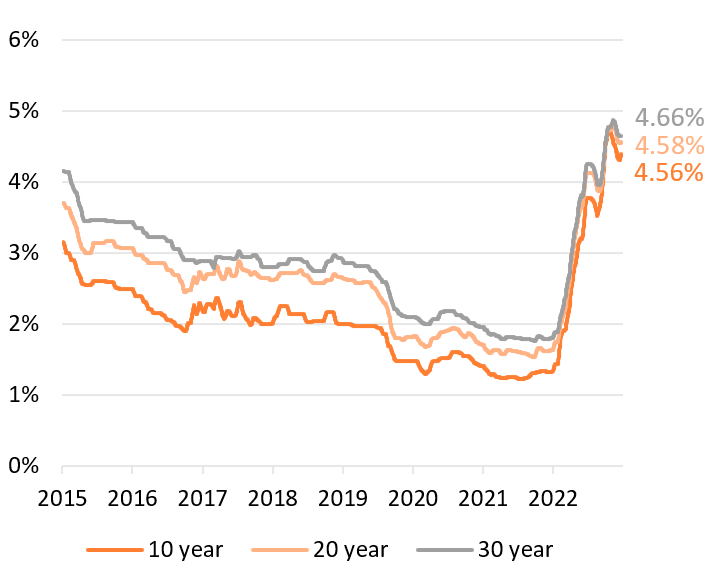
As financial market unrest reflects, it is hard to predict future inflation and interest rate developments. We therefore can only assume a continuation of the current market circumstances, with high mortgage rates, as a basic starting point for our outlook.


Economics

The outlook for the Dutch economy will be shaped by further implications of inflation on the general price level and hence consumer spending. Since energy prices are declining and the Dutch government implemented a comprehensive support package, the impact of energy prices is expected to be limited. However, as energy prices already seeped through commodity and food prices, it is assumed that these secondary effects will be dominant for the economic conditions in 2023.

In line with inflationary pressures, the ECB will determine whether it should continue to intervene by raising its key policy rates, and when it has achieved the desired interest rate in order to slow down the economy, thereby reducing inflation. A concern would be that raising the key policy rates, could potentially result in a decline in economic activity and hence a large increase in unemployment.


Housing market

The housing market is strongly affected by financial conditions and mortgage affordability. In addition, the market sentiment, how potential buyers perceive the market, also plays an important role.

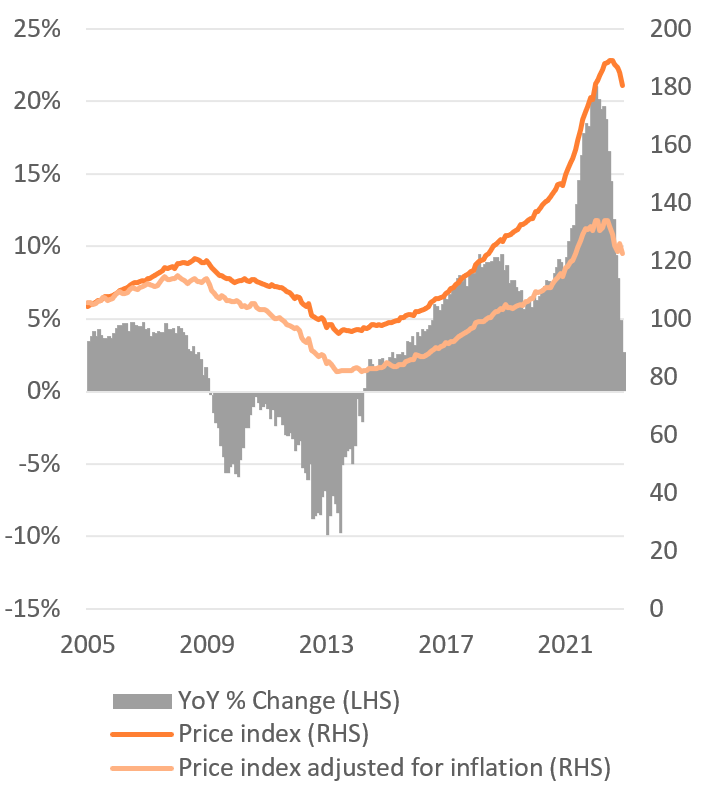
As long as there is uncertainty, buyers will remain cautious, while sellers will focus on the best time for their sale. A decrease in demand could lead to a further reduction in the number of housing transactions and eventually have a negative impact on house prices.

In a situation where house prices continue to fall, the housing market potentially becomes more accessible to households with fewer financial resources, such as first-time buyers. Nevertheless, the severe housing shortage remains a major complication for the market. Especially in combination with rising household income, it is expected that both factors absorb some of the downward pressure in housing prices.


Mortgage market

The mortgage market has changed fundamentally over the past year and is not expected to revert as long as mortgage rates remain at the level as they currently are. Therefore, we expect that the attractiveness of shorter fixed-interest periods will prevail over longer fixed-interest periods in 2023 and the market share of refinancers (primarily lower LTV buckets) will remain limited. Borrowers are expected to make more use of the mover option and continue the mortgage with their current lender. As a result of that, a part of the market will remain unavailable to other lenders.

With high mortgage rates, the households' maximum borrowing capacity will be limited, which is expected to result in a continuation of the current lower number of mortgage applications and subsequently in mortgage volume.


Dutch residential mortgages

As the Dutch lending standards are generally conservative both existing and new borrowers are expected to be able to cover unexpected shortfalls or extra costs. Therefore, Dutch mortgages are expected to perform well, with correspondingly low levels of arrears and losses.

Although we cannot predict future interest rate developments, based on historical trends we expect that the spread on Dutch mortgages value will remain relatively attractive compared to other assets with a comparable risk profile such as government bonds and credits.

Economic indicators

Since energy prices have fallen, higher commodity and food prices have become the most dominant factors affecting households’ purchasing power. The Dutch economy should be able to absorb these developments as it has a tight labor market, accumulated household savings and an extensive support package from the Dutch government.


Economics

After a mild and temporary economic slowdown in Q3 2022, the Dutch economy grew by 0.6% QoQ and 3% YoY in Q4 2022 according to the Dutch Central Bureau of Statistics (CBS). The growth in Q4 was mainly attributed to continued spending from consumers on services and an increased volume of the export and imports of goods and services.

Over the course of 2022, GDP grew by 4.5% YoY, however, we should take into account that during 2021, the Dutch economy faced several restrictions due to COVID-19.

In December, the Governing Council of the ECB decided to raise its key policy rates by 50 basis points for the fourth time this year. The ECB stated that, based on the substantial upward revision of the inflation outlook, interest rates will still have to rise but at a steady pace during 2023. This is to ensure interest levels are sufficiently restrictive for a timely return of inflation to the 2% target.
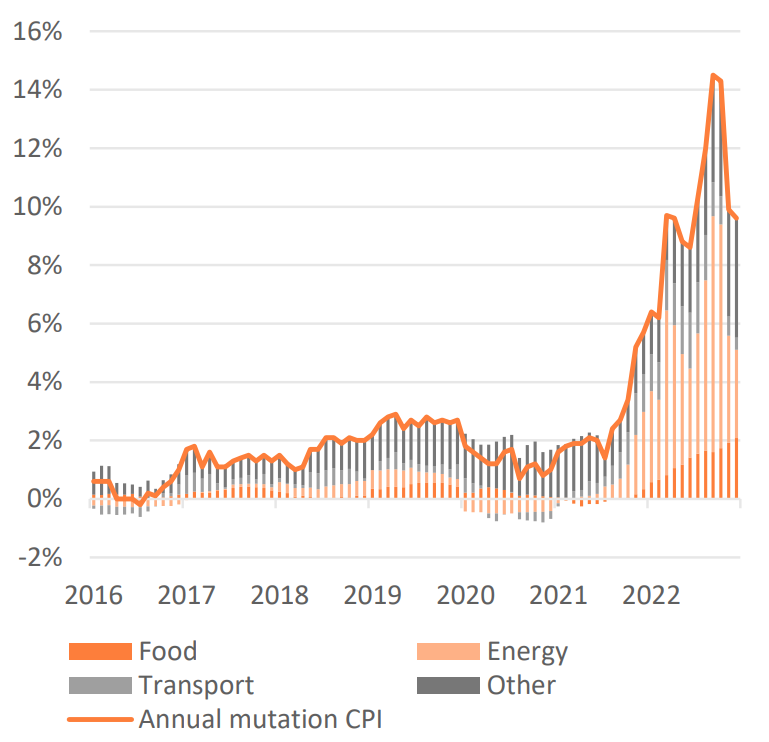
 

Inflation

Inflation has been well above acceptable levels for some time and is expected to remain so for the foreseeable future. Whereas initially, energy prices were the most decisive driver of inflation, commodity and food prices have recently become increasingly relevant in consumers' daily lives. In particular, the underlying ‘core inflation, excluding energy and food prices’ has been rising steadily recently.

With the drop in energy prices, inflation decreased from 14.5% in September (including 2.8% for electricity and 5.2% for gas) to 9.6% in December (including 1.2% for electricity and 1.8% for gas). While this trend seems positive, it is important to realise that across the economy underlying price pressures, often as a result of higher energy prices, have strengthened and will persist for some time. This is particularly the             


case for the production of food and commodities, as high manufacturing costs are passed through to consumer prices.

The high level of inflation will persist throughout 2023. On one hand, inflation is being depressed by the price ceiling introduced by the Dutch government. The ceiling sets a maximum price for energy consumption. As a result, only a (small) portion of energy consumption is exposed to market prices. On the other, the broadening of inflation continues as companies will pass on the increased energy costs to consumers since many have fixed energy contracts and have not yet had to absorb the full energy price increase. In addition, companies are also expected to pass on increased labour costs.

Sentiment indicators

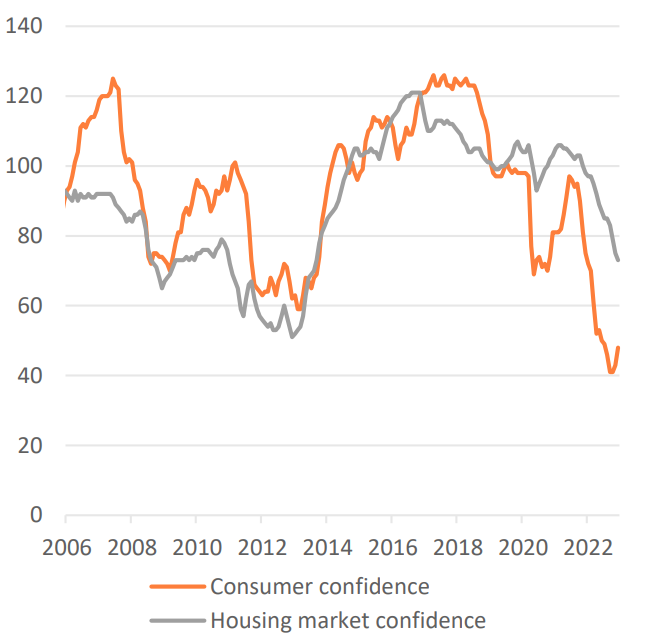
After reaching an all-time low of 41 at the end of Q3 2022, consumer confidence [1] improved to 48 in Q4 2022.

The improved consumer confidence is mainly driven by less pessimism about the economic outlook and the financial situation of households for the next 12 months. Although confidence has improved in recent months, the indicator is still at a historically low level.

Despite the lack of confidence throughout the year, consumers maintained a high level of consumption. This can be attributed to accumulated savings during COVID-19, which allowed a strong recovery of spending after the lockdown. The catch-up effect, however, is beginning to diminish as the effect of inflation on consumption becomes more visible, potentially leading to a contraction of consumption.            

Confidence in the housing market [1] fell to 73 at the end of 2022. The negativism about the housing market is still primarily driven by higher mortgage rates (reducing the borrowing capacity), house price trends and general economic conditions. The negative sentiment also affects the market, as people could anticipate to future price declines and therefore postpone their purchases.

Labour market

With an overall unemployment rate of only 3.6% in Q4 2022, the labour market provides some protection against the loss of purchasing power of households due to inflation. The perceived financial assurance does not only stem from wage retention, but also from wage increases during 2022.

Collective wages grew by 3.7% QoQ in Q4 2022 and 3.2% YoY in 2022, which are the largest increases since 2000 and well above historical averages. In addition to wage increases, many companies offered their employees additional (financial) support.

Furthermore, in 2023 the minimum wage and the associated state pension will rise by 10% too.

Figure 1: Inflation in the Netherlands, end of December 2022 (Source: CBS)
Figure 2: Confidence indicators and house price index,  end of December 2022 (CBS & VEH)
Figure 2: Confidence indicators and house price index, end of December 2022 (CBS & VEH)

Housing market

Affected by increased uncertainty, supply and demand dynamics have changed significant. Buyers are more cautious, while sellers are more careful with the timing of their sales. As a result, the number of housing transactions declined, however, due to a severe housing shortage house prices remained relatively stable on a yearly basis.


Transaction volume and housing supply

During Q4 2022, the number of transactions remained relatively stable at 51,000, which is only 1.8% higher than the previous quarter. The increase of 1.8% is remarkably low as normally more houses are sold in Q4 than in Q3, as Q3 includes the summer months. On a year-by-year basis, the number of transactions fell slightly by 2.8%.

When considering the number of transactions on a 12-month rolling basis, the market continues to decline. Whereas the 12-month average at the end of 2021 was nearly 223,000, the 12-month average at the end of 2022 was down to 193,000, marking a decline of more than 14%. However, despite the sharp decline, 193,000 transactions is still high from a historical perspective.             


As buyers have become more cautious, there has been a sharp decline in the number of viewers and subsequently the number of bids. As a result, the number of houses for sale has increased gradually to almost 35,000 (15,500 in Q4 2021) according to the NVM.

The mismatch between supply and demand is also apparent when looking at the market tightness indicator. This indicator measures the ratio of the current number of houses for sale (supply) to transactions (demand). While the ratio reached its lowest point of 1.3 one year ago, it improved to 3.2 in Q4 2022. This indicates that prospective buyers have an average of 3.2 homes on offer to choose from.

Higher energy prices have generated increased attention to sustainability. As buyers appear to be more critical of energy consumption, the energy efficiency of homes has become increasingly important.


New construction and housing shortage

The severe housing shortage still has major complications for the dynamics of the Dutch housing market. Despite government efforts such as the National Housing and Construction Agenda, solving the shortage will be a long-term process, possibly beyond 2030. Despite the accumulated backlog in both new-build houses and building permits, the most recent figures from CBS show that more than 74,000 new homes have been added to the housing stock in 2022, the highest number since 2012.

Unfortunately, the 74,000 new homes are mainly due to higher numbers of granted permits in 2020 and 2021, as it typically takes some time between granting a permit and the completion of the construction. Therefore, in order to properly overcome the shortage, the number of granted permits must increase in the coming years. However, with barely 60,000 permits granted in the first 11 months of 2022, the construction of newly built houses is expected to slowly decline again in the near future.

The low number of granted permits is not only due to a dysfunctional process or the recent ruling of the Dutch Council of State about the violation of European nature conservation rules. As a result of the increased interest rates and the sharp increase in construction costs [2], new construction projects are less financially viable, hence developers are facing more problems with affordability.

Developers can no longer pass on the higher costs of new construction projects to new buyers, as interest rates have reduced the borrowing capacity. In addition to lower borrowing capacity, prices of existing properties are showing a decline, widening the price differential between new and existing houses. Another problem is the duration of construction projects: due to the economic conditions and increased uncertainty, consumers are less inclined to choose for new-build homes, considering they have a relatively long lead time. As a consequence, construction projects of newly built houses are therefore financially less attractive for developers.

Nonetheless, new construction projects are crucial for expanding the housing stock. Therefore, it is important to improve the marketability of construction projects and thereby preventing failed projects.


House prices

Through 2022, the year-on-year development of the Dutch house price index has gradually flattened from 21.1% in January to only 2.7% in December. While the year-on-year development is still positive, the house price index fell by 2.4% QoQ in Q4 2022, according to the Land Registry.

Taking the development of the nominal house price into account, prices increased by 1.2% YoY. More noteworthy is the development of the nominal house price over the past 5 months. While the house price peaked in August with an average nominal amount of 446,000 euros, the average nominal purchase price was only 401,000 euros in December, marking a substantial decline in nominal house prices during past months.

The sharp decline can be explained by I) deteriorated affordability of potential buyers, II) less overbidding due to lower confidence indicators and III) the composition of sales in terms of regions and price segments.       


The 2.4% QoQ decline in house prices, as recorded by the Land Registry, is in line with the descending trend published by the brokers' association NVM earlier (-5.3% QoQ in Q3 2022). However, contrary to the Land Registry, the NVM already measured a decline in nominal house prices of 6.4% YoY in Q4 2022. This difference stems from the transaction’s time of registration. As a result, the NVM registers a transaction on average 2 to 3 months earlier and is therefore a useful, but limited, predictor of house price trends.

We do not expect a crunch in house prices, as the housing shortage will partially counterbalance a further decline in house prices. It is important to put into perspective that house prices have been rising sharply for years, with a recent peak in growth of 21.1% YoY in January.

Figure 3: Number of transactions & tightness indicator,  end of December 2022 (Source: CBS & Land Registry) & (Source: NVM)
Figure 3: Number of transactions & tightness indicator, end of December 2022 (Source: CBS & Land Registry) & (Source: NVM)
Figure 4: House price development 2015=100,  end of December 2022 (Source: CBS & Land Registry)
Figure 4: House price development 2015=100, end of December 2022 (Source: CBS & Land Registry)

Mortgage market

Higher mortgage rates have fundamentally changed the mortgage market, as households are more likely to opt for shorter fixed-interest periods and refinancers have pulled out of the market. Consequently, the mortgage market is, in line with the number of applications, expected to become smaller in the foreseeable future.


Mortgage applications

After the peak of 191,000 mortgage applications in Q1 2022, the number of applications has gradually declined. With nearly 85,000 applications, the number of applications was significantly lower in Q4 2022. Compared to the previous quarter, there was a decline of more than 17%. However, when compared to Q4 2021, the number of applications declined by almost 46%.

The sharp decline in mortgage applications can be explained by the withdrawal of refinancers from the market. Due to the higher mortgage rates, refinancing became less attractive since switching to current mortgage rates was no longer profitable. Simultaneously, an increasing number of borrowers took their existing mortgage conditions to a new property (the so-called mover option). Whereas mover loans accounted for only 0.4% of the applications in March, at the end of 2022 this has increased to over 14%.

An important component of the mover option is that borrowers who are using this option continue their mortgage with the current lender and will not re-enter the mortgage market. Therefore, this means that an increasing part of the market is not available to other lenders.

The higher mortgage rates not only caused the group of refinancers to withdraw, but it also resulted in a deterioration of the borrowing capacity. Borrowers were forced to opt for shorter fixed-interest periods, which increases their maximum borrowing capacity. As mortgage rates remained high in Q4 2022, the market shares of longer fixed-interest periods and shorter fixed-interest periods remained fairly unchanged at 30% and 70%, respectively.


Number of originated mortgages and market volume

The significant decline in mortgage applications is not yet fully reflected in the number of originated mortgages or market volume. This is because it generally takes a couple of months before a mortgage application has been completed and the mortgage is issued. Nevertheless, the gradual decline in recent quarters has already led to a sharp decline in the market.

As a result, mortgage volume fell to 31 billion euros (-19% QoQ and -30.1% YoY) in Q4 2022. In the same period, the number of originated mortgages fell to 94,000 (-16.9% QoQ and -29.8% YoY). When looking at the overall trend of 2022, mortgage volume fell to 154 billion euros (-5.6% YoY), while the number of originated mortgages fell to 460,000 (-10.3% YoY).

In line with the significant decline in mortgage applications, it is likely to assume that the mortgage market will remain subdued, particularly if current market conditions persist. Although the contraction of the market is significant, it is important to put this into perspective given the extremely large volumes of past years.


Affordability

In the latest annual advice of the National Institute for Family Finance Information (Nibud) on mortgage lending standards for 2023, Nibud advised a tightened of the lending standards as the change in purchasing power of households, affected by inflation, on a 4-year average must be taken into account according to a predetermined methodology.

As of 2023, households will be able to borrow on average between 3% and 3.8% less, assuming that household income and mortgage rates will remain constant. For lower- and middle-income homebuyers, this implies a reduction in borrowing capacity between 5,000 and 9,000 euros. Higher-income homebuyers will be able to borrow between 14,000 and 22,000 euros less. However, as wages have increased substantially in 2022, the largest part of the tightening has been offset.

Therefore, the tightening of the lending standards is expected to have only a marginal effect compared to the effect of rising mortgage rates, as these have more than tripled. The higher interest rates have reduced the maximum mortgage amount for borrowers by tens of thousands of euros.

In line with expectations, NIBUD also advised loosening the rules for second incomes: a second income in a two-person household will count for 100% instead of 90%. Besides income, the NHG limit will rise from 355,000 euros to 405,000 euros (with energy-saving measures, the cost limit will be 429,300 euros), improving the position of first-time buyers.


Mortgage rates and spreads

In 2022, swap rates rose significantly, from 0.34% in January to 3.34% at the end of December. Whereas swap rates rose gradually in the first half of 2022, they were much more volatile in the second half of the year due to two periods of significant declines. Since mortgage rates are highly correlated with swap rates, the same pattern is also apparent in the development of mortgage rates.

Unlike mortgage rates, mortgage spreads were much more volatile throughout the year. In early 2022, spreads on Dutch mortgages lagged behind the development of the interest rates, and hence were tight. After the drop in swap rates due to economic uncertainty in mid-2022, mortgage spreads widened substantially. 

However, the revival of the spread was only short-lived as the swap rate increased as the ECB increased their policy rates, causing the mortgage spread to tighten again. A similar pattern occurred in Q4 2022, the spread widened as the quarter proceeded, but tightened mid-December after the ECB increased its key policy rates again.

Figure 5: Market share distribution per fixed-rate period,  end of December 2022 (Source: HDN)
Figure 5: Market share distribution per fixed-rate period, end of December 2022 (Source: HDN)
Figure 6: Average mortgage rates per fixed-rate period, end of December 2022 (Source: DMFCO)

Relative value compared to other LDI asset classes

Liability-driven investment (LDI) reduces a portfolio’s exposure to unrewarded interest rate risks by investing in asset classes that are affected by those factors in the same direction and magnitude as liabilities. The main assets used for LDI are interest rate swaps, government and corporate bonds, and mortgages.

Dutch residential mortgages have historically consistently outperformed investment grade (IG) German government bonds and corporate bonds, two other non-derivative instruments generally used for LDI. German 10-year government bonds, while highly liquid and with negligible credit risk, provide significantly lower returns. IG corporate bonds returns have a comparable risk profile, but also lower returns.


Mortgage performance

The Dutch mortgage market continued to perform very well with low levels of losses and arrears. Moreover, there are still no signs of a substantial increase in the number of losses or arrears.

To provide a projection of losses for the coming year in the Dutch mortgage market we use stress test data provided by Moody's Analytics using Moody's Portfolio Analyser and public mortgage loan data. The stress tests are based on 4 macro scenarios as described below.

In all scenarios losses are expected to remain very low:

  1. The Baseline scenario assumes that the growth outlook for the remainder of the year has improved. A recession is nonetheless avoided and demand increases. Global energy prices decline and supply bottlenecks ease.
  2. The Stronger Near Term Growth scenario assumes global energy prices to decline faster than the base case scenario. Supply bottlenecks improve somewhat more quickly than expected, while slack in the economy proves slightly larger than initially thought.
  3. The Moderate Recession scenario assumes geopolitical tensions persist, weakening consumer and business sentiment. Global energy prices will continue to remain higher, as do nonenergy commodity prices, exacerbating HICP inflation. Supply bottlenecks persist throughout 2023.
  4. The Protracted Slump scenario assumes significant limits to the supply of oil and natural gas, causing energy prices to jump. The double hit of the Russian invasion and the pandemic leads to the re-emergence of political tensions that cause a selloff in financial markets.
Figure 7: Dutch residential mortgage spreads w.r.t. EUR swap and the spread of other LDI assets, end of December 2022 (Source: DMFCO & Bloomberg)

Number

Scenario

Arrears amount [3]

Expected loss [4]

1

Baseline

12.1bps

1.28bps

2

Stronger Near Term Growth

11.9bps

1.27bps

3

Moderate Recession

13.2bps

1.45bps

4

Protracted Slump

14.2bps

1.60bps


Annex I: Key indicators

Indicator

Q4 2021

Q1 2022

Q2 2022

Q3 2022

Q4 2022

Q-o-Q

Y-o-Y

Consumer confidence

75

61

50

41

48

+7 points

-27 points

Housing market confidence

98

95

87

83

73

-10 points

-25 points

General unemployment

3.8%

3.5%

3.3%

3.7%

3.6%

-0.1%-point

-0.2%-point

Inflation

5.7%

9.7%

8.6%

14.5%

9.6%

-4.9%-point

+3.9%-point

Mortgage applications

157,042

191,293

142,019

102,918

85,182

-17.23%

-45.8%

Mortgage volume (in billions)

€44.65

€39.66

€45.60

€38.05

€30.81

-19.03%

-31.0%

# of originated mortgages

134,609

117,692

135,997

113,680

94,482

-16.89%

-29.8%

House price index

175.1

182.4

187.5

188.6

184.1

-2.39%

+5.1%

Average purchase price

€402,726

€426,787

€429,010

€443,042

€415,546

-6.21%

+3.2%

Transactions

52,798

43,923

47,382

50,453

51,345

+1.77%

-2.8%

ECB refinancing rate [5]

0.00%

0.00%

0.50%

1.25%

2.00%

+0.75%-point

+2.0%-point

10-year German Government bond rate

-0.18%

0.55%

1.37%

2.12%

2.57%

+0.45%-point

+2.8%-point

10 years mortgage rate

1.33%

2.21%

3.76%

4.49%

4.56%

+0.07%-point

+3.2%-point

20 years mortgage rate

1.63%

2.57%

4.12%

4.54%

4.58%

+0.04%-point

+3.0%-point

30 years mortgage rate

1.80%

2.66%

4.25%

4.53%

4.66%

+0.13%-point

+2.9%-point

10 years mortgage spread

105.33

104.35

167.55

147.28

138.55

-8.73 bps

+33.22 bps

20 years mortgage spread

121.40

139.98

198.45

161.28

153.8

-7.48 bps

+32.40 bps

30 years mortgage spread

142.45

156.63

218.63

171.38

172.55

+1.17 bps

+30.10 bps


Indicator definitions

Indicator

Source

Definition

Unemployment

CBS

The number of people who are between 15 and 75 years old who are not in work but are actively searching for paid work and are directly available to work.

VEH indicator

VEH

Indicator for confidence in the Dutch owner-occupied housing market/willingness to buy a house.

Consumer confidence

CBS

Percentage points of the total answers to the questions on the economic situation, the financial situation and whether now is the right time to make large purchases.

GDP

CBS

The size of an economy by taking the sum of final uses of goods and services (final consumption/gross capital formation) plus exports and minus imports

House prices

CBS /Kadaster

All sales transactions recorded by Kadaster as well as the municipal valuation of all homes in the Netherlands.

Housing shortage

ABF research

The difference between the housing requirement that is not met (demand side) and the available supply.

Market share

Kadaster

The market shares of different lenders are determined, based on mortgage registrations provided by Kadaster.

Transactions

Kadaster

Number of home sales registered by the Kadaster and conducted by a notary

Market tightness indicator

NVM

An approximation by the NVM of the number of options that a potential buyer has in the housing market. The NVM covers approximately 75% of the market.

Mortgage volume

Kadaster

The total annual mortgage turnover together with the total number of mortgages provided annually.

Market share

Kadaster

The market shares of different lenders are determined, based on mortgage registrations provided by Kadaster.

Newly built properties

CBS

# of new constructions added to the existing stock, from the Key Register of Addresses and Buildings.

granted permits

CBS

# of granted building permits (building environment permits with activity) as documented in the Housing Act.

Affordability

Calcasa

The percentage of the net monthly income spent on net housing costs.

Mortgage spreads

DMFCO

The difference between the mortgage rate and the EUR swap curve.

Spread credit benchmark

Bloomberg

This is the option-adjusted spread between the Bloomberg Barclays investment-grade global credit benchmark and the risk-free rate of return.

Spread German 10yr Bonds

Bloomberg

Spread between the yield on a 10-year German government bond and the risk-free rate of return.


1. The indicators have a range between 0 (negative) and 200 (positive). A value of 100 is neutral.

2. According to the CBS, construction costs have rising by 8.4% in 2022, primarily due to a sharp rise in costs for raw materials (12.2%). With the current rate of inflation, a further increase in costs is expected for 2023.

3. Annualised probability of default.

4. The expected annualised loss is the sum of the values of all possible losses, each multiplied by the probability of that loss occurring over a lifetime horizon (a duration of 7 years is taken into account).

5. As of February 8th, the ECB increased their refinancing rate with 0.50% to 2.50%.


Stay up to date

Would you like to stay informed about developments in the field of investing in Dutch mortgages? Sign up for our updates.

Wij gebruiken cookies om uw ervaring te verbeteren!