18/09/2023

Dutch housing and mortgage market Q2 2023

Sjoerd van Dijck
Sjoerd van Dijck
Investor Relations
Sjoerd van Dijck

The Dutch economy experienced a slowdown for the second time in a row, and thus fell into recession. This was mainly due to a decline in household spending and export. To curb inflation further, the European Central Bank (ECB) has increased its main policy rate again. The ECB also stated that inflation will persist at a high level for longer than expected.

The Dutch housing and mortgage market is picking up as mortgage interest rates show signs of stabilisation and increasing wages keep affordability in balance. In contrast to the previous year, Q2 2023 has witnessed an increase in both home sales and mortgage origination volumes, indicating a possible change in trend. There are also early signs that a further decrease in house prices might be averted.


Main developments

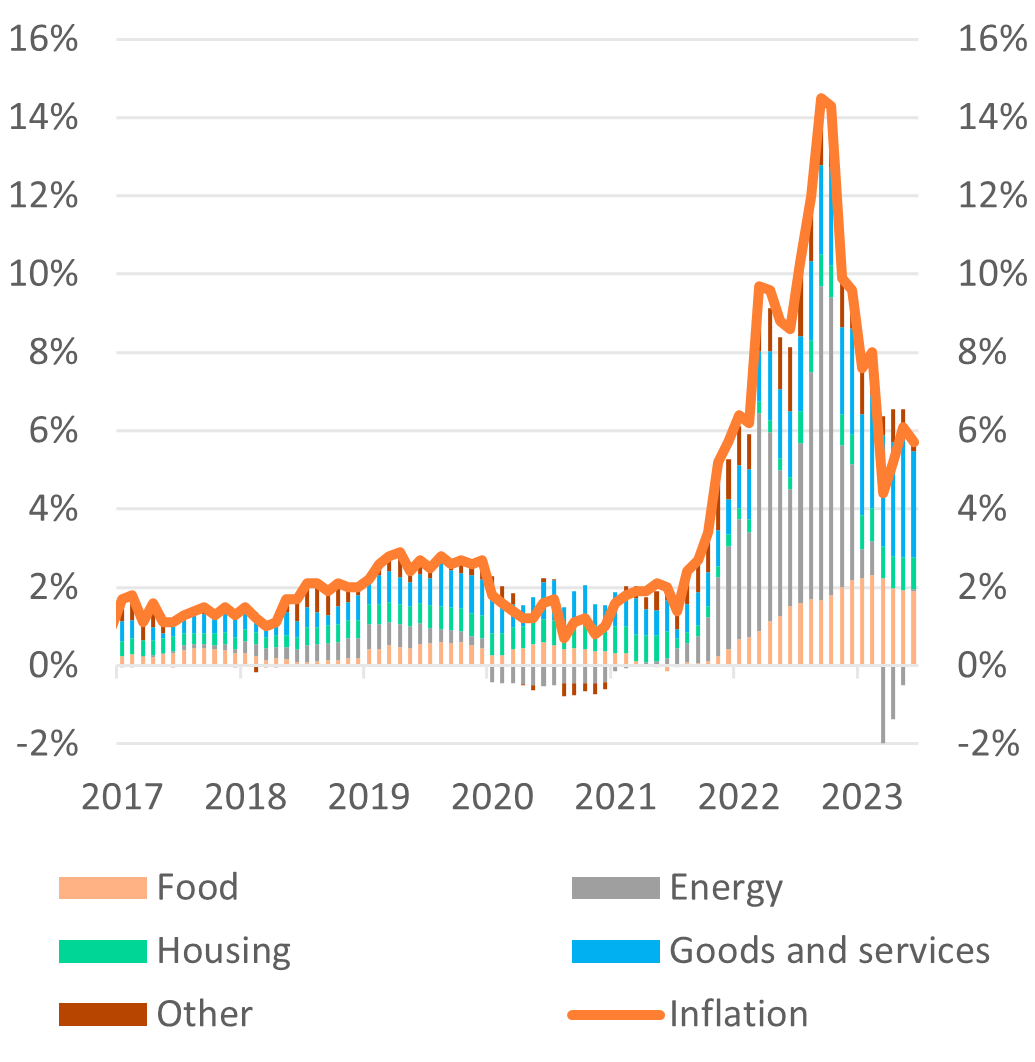
In recent months, inflationary pressure has sharply declined due to falling energy prices. Nevertheless, high inflation continues to persist. One of the main reasons for this are rising prices of groceries, in particular food.

The cost of groceries continues to rise due to higher costs for producers and suppliers. This is partly because companies are still feeling the impact of high energy prices from a year ago. Another reason is that wages have significantly increased due to high inflation. Rising wages, in turn, lead to new price pressures, which is one of the reasons why core inflation is expected to remain high. As a result, the ECB will continue its contractionary monetary policy.

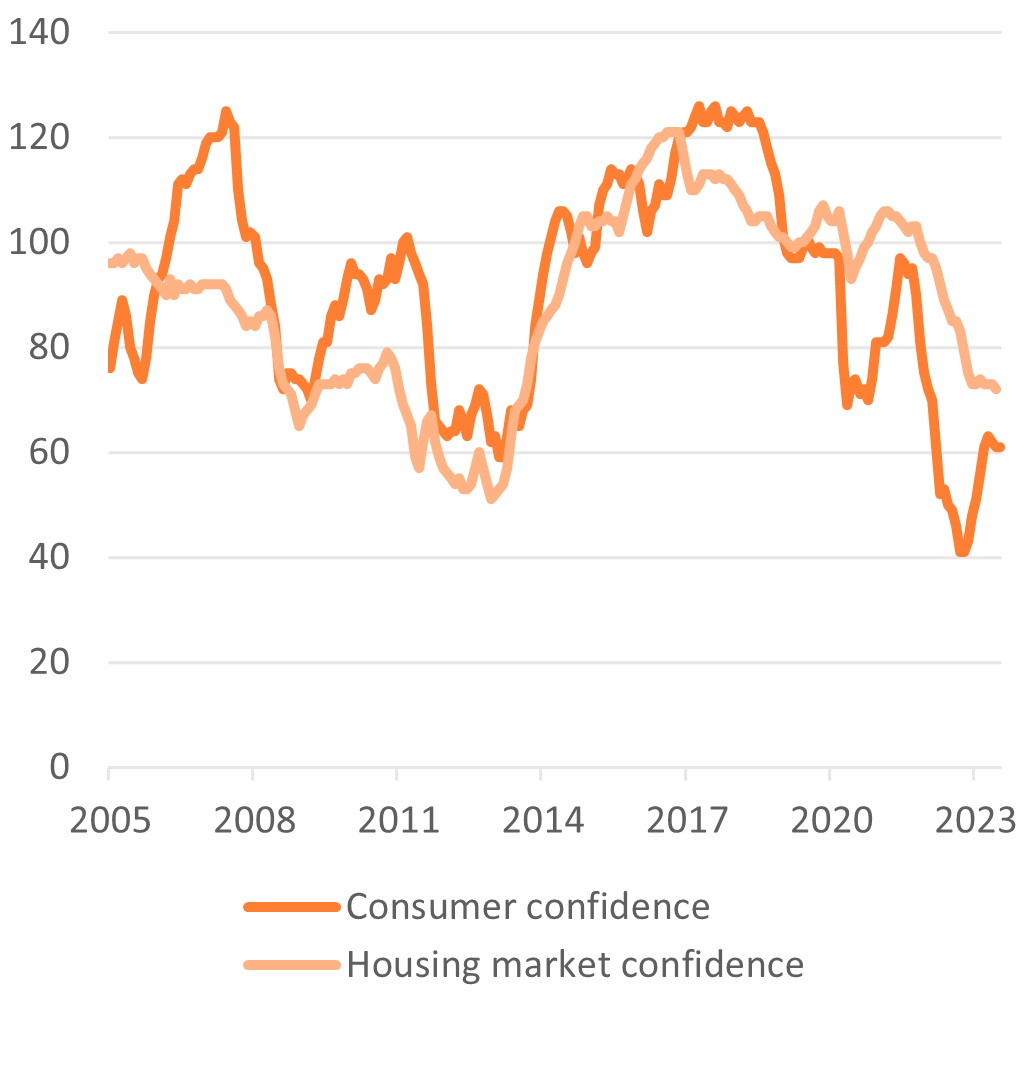
High prices of everyday products continue to play a vital role in consumers’ lives and thus affect their sentiment. As a result, consumer sentiment remained negative. In contrast, certain underlying factors such as opinions on the financial and economic situation for the next 12 months have improved.

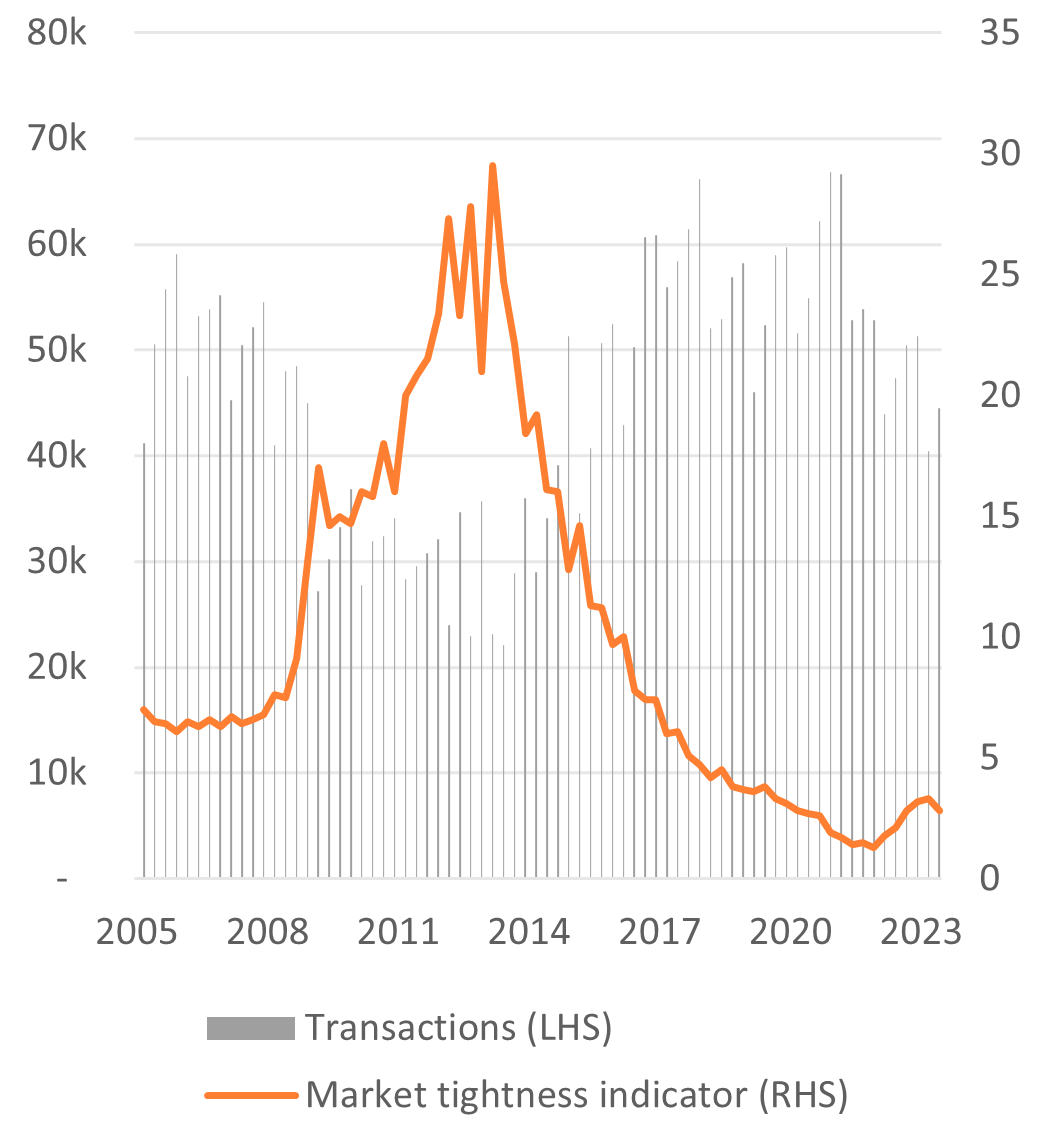
The housing market is showing mixed signals. The number of transactions rose by 10% QoQ to 45,000 in Q2 2023. However, the outlook for future transactions for both new and existing homes is far from favourable due to various issues hindering the construction sector. This could potentially limit the number of newly built homes and hence future transactions.

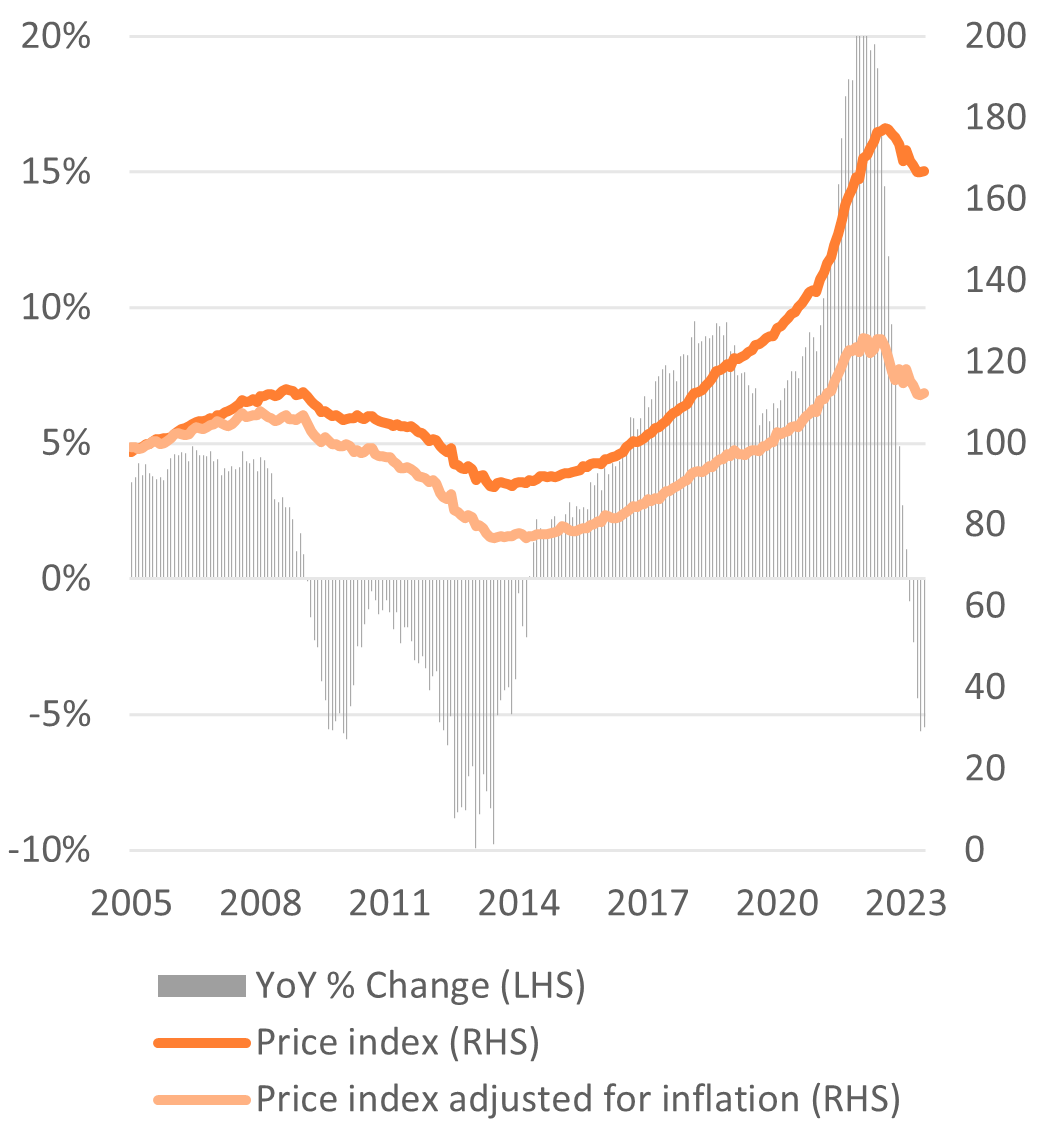
In Q2 2023, house prices fell by 1.9% QoQ, from an average price of 417,000 euros to 406,000 euros. The decline was mainly observed in the four largest cities and houses in the higher price segment. House prices remain uncertain but may rise again due to several factors. These include stable housing sentiment, stable mortgage interest rates, scarce supply of new houses, and higher wages.

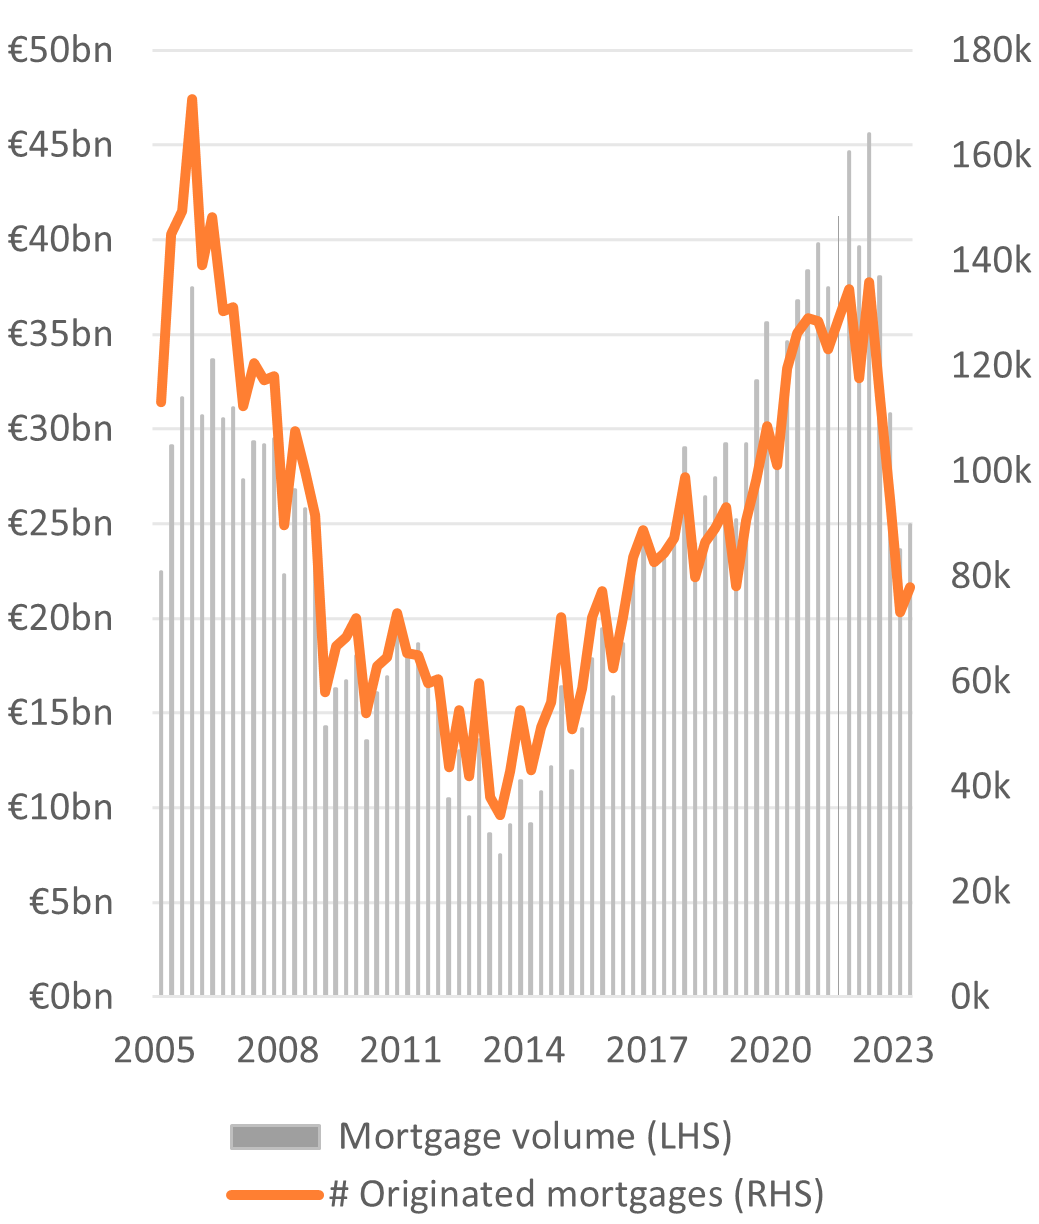
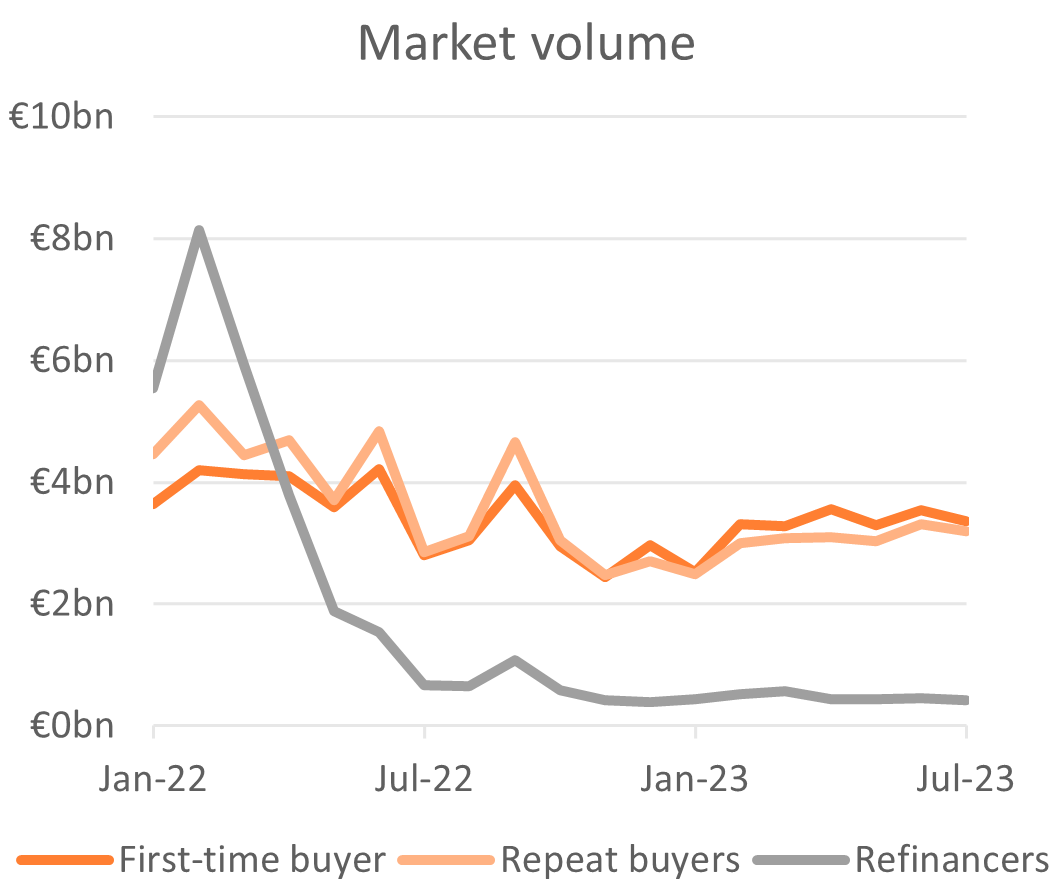
The number of mortgage applications has risen again, following the trend of more transactions. In Q2 2023, there were 93,000 mortgage applications, a slight increase of 1.8%. This was 9.2% higher than the recent low in December, when only 85,000 applications were recorded.

The upward trend in mortgage applications in the last two quarters resulted in the origination of a total of 78,000 mortgages (+6.4% QoQ and -43% YoY) with a total mortgage volume of 25 billion euros (+5.6% QoQ and -45% YoY). The Dutch Central Bank (DNB) confirmed this trend in its Bank Lending Survey, saying that the market is improving slightly.

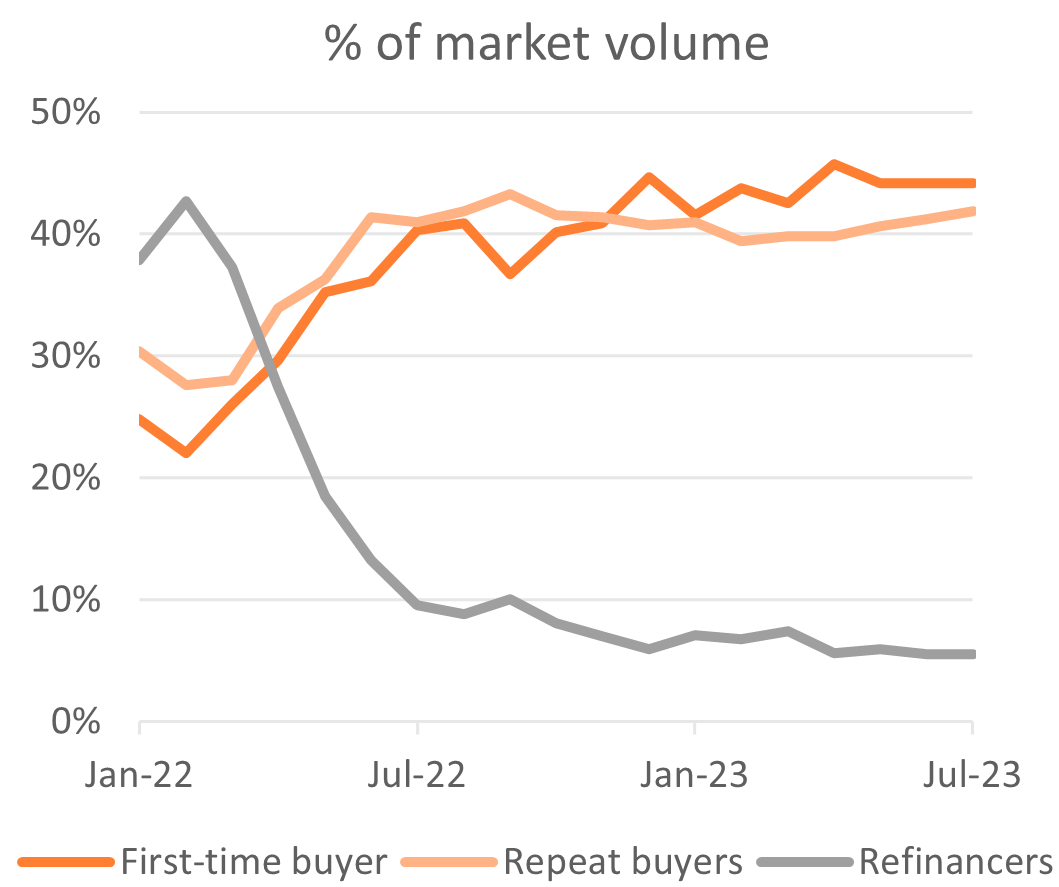
According to the Dutch mortgage network (HDN), first-time buyers are increasingly entering the market now that the situation has improved. This is due to two important regulatory changes early 2023, wages increased and declining competition from, for example, private investors. Furthermore, the Dutch central bank (DNB) reported that affordability in the Dutch housing market has improved.

While the macroeconomic environment contains warning signs of credit deterioration as a result of economic uncertainty and persistent inflation, Dutch residential mortgages continue to perform strongly and outperform other credit assets.

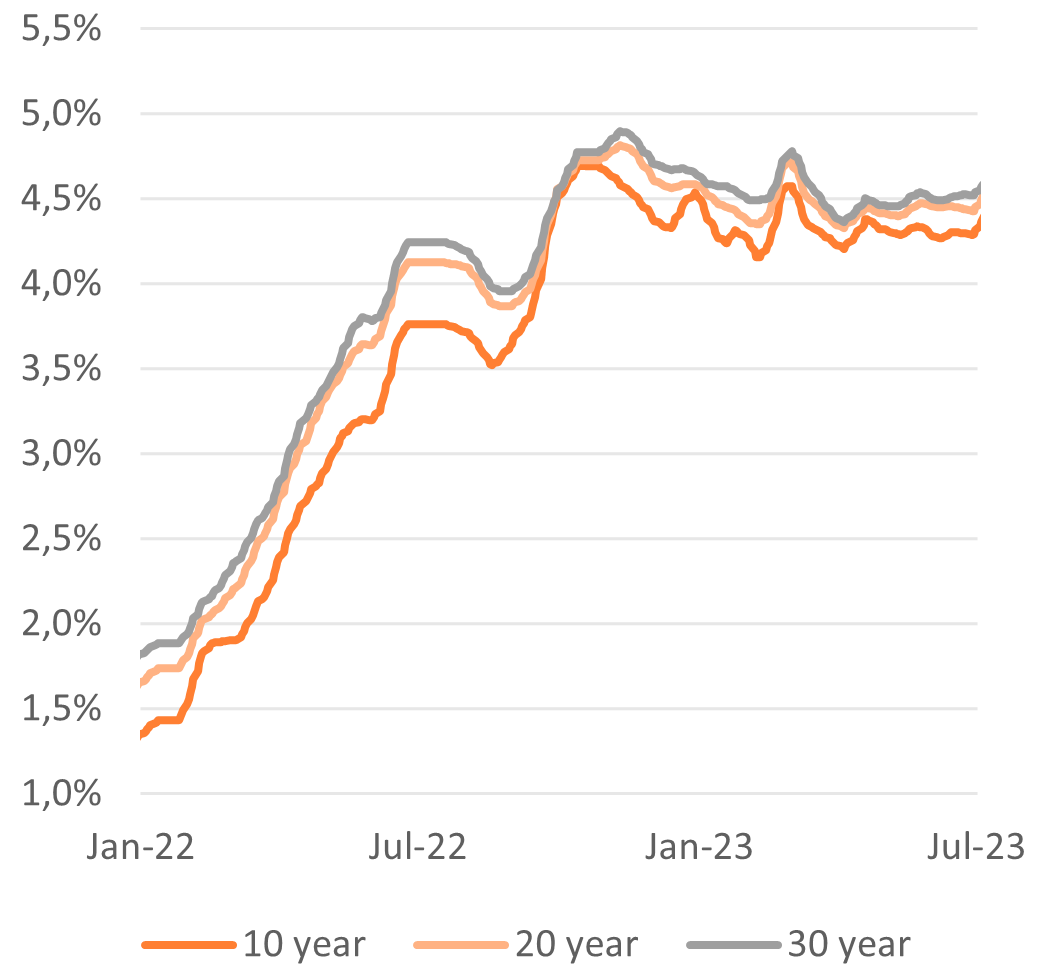
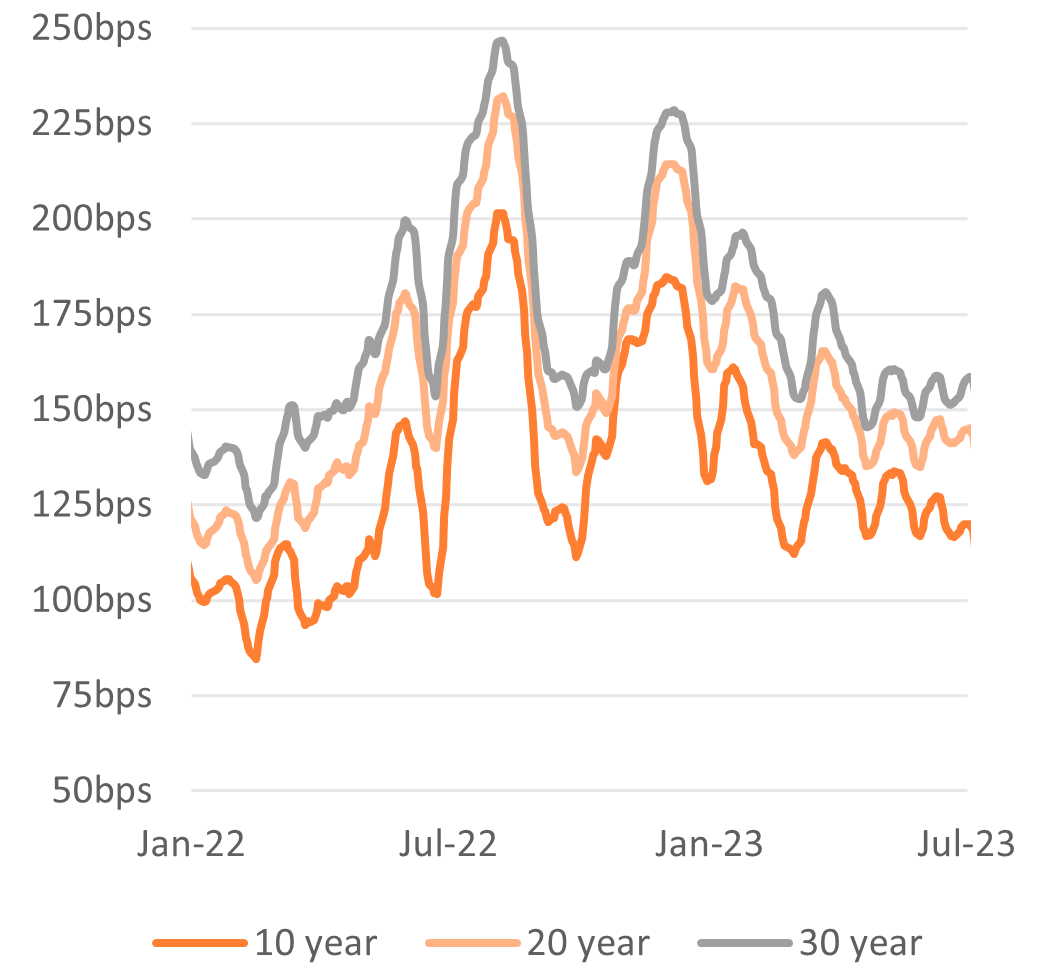
With mortgage origination volumes slowly picking up, both mortgage interest rates and spreads remain volatile. Notwithstanding the volatility, both mortgage interest rates and spreads stayed relatively stable compared to Q1 2023.


Economic indicators

Economies are increasingly affected by persistent inflation and high interest rates. In the Netherlands, lower household spending and a deterioration in exports led to a mild recession. Despite that, the labour market remains tight, and consumers are becoming more optimistic about the future.


Economics

After a contraction of 0.4% QoQ in Q1 2023, the economy experienced a further slowdown of 0.3% QoQ in Q2 2023, leaving the Dutch economy officially in a (mild) recession. However, when looking at the real economy (taking inflation into account), there has been a downward trend for some time now. On an annual basis, the economy also contracted by 0.3% YoY in Q2 2023. The deterioration in the economy is driven by lower household spending and exports, partly due to a deterioration in the German economy, the Netherlands' main trading partner.

With the Dutch economy slowing for the second quarter in a row, the Dutch economy is performing much worse than its neighbours. The economies of Belgium and France, for example, continued to grow (albeit modestly). The same applies to the eurozone economy as a whole. Only Germany is underperforming like the Netherlands.

The good performance of the economies in the Eurozone makes it more likely central bankers will be able to control inflation without disrupting growth. Making a ‘soft landing’ possible. At the same time, monetary policy takes time to work its way through the economy. In fact, some signs, such as weak demand in manufacturing, suggest that stress may arise in the coming quarters.

The European Central Bank maintained its contractionary monetary policy and raised its policy rates by 25bps in May and June1. The impact of the European Central Bank's policy is increasingly apparent in the credit standards and demand for corporate loans. The credit standards for these loans tightened further in Q2 2023, making the cumulated net tightening since the beginning of 2022 substantial. Also firms’ net demand for loans fell sharply.


Inflation

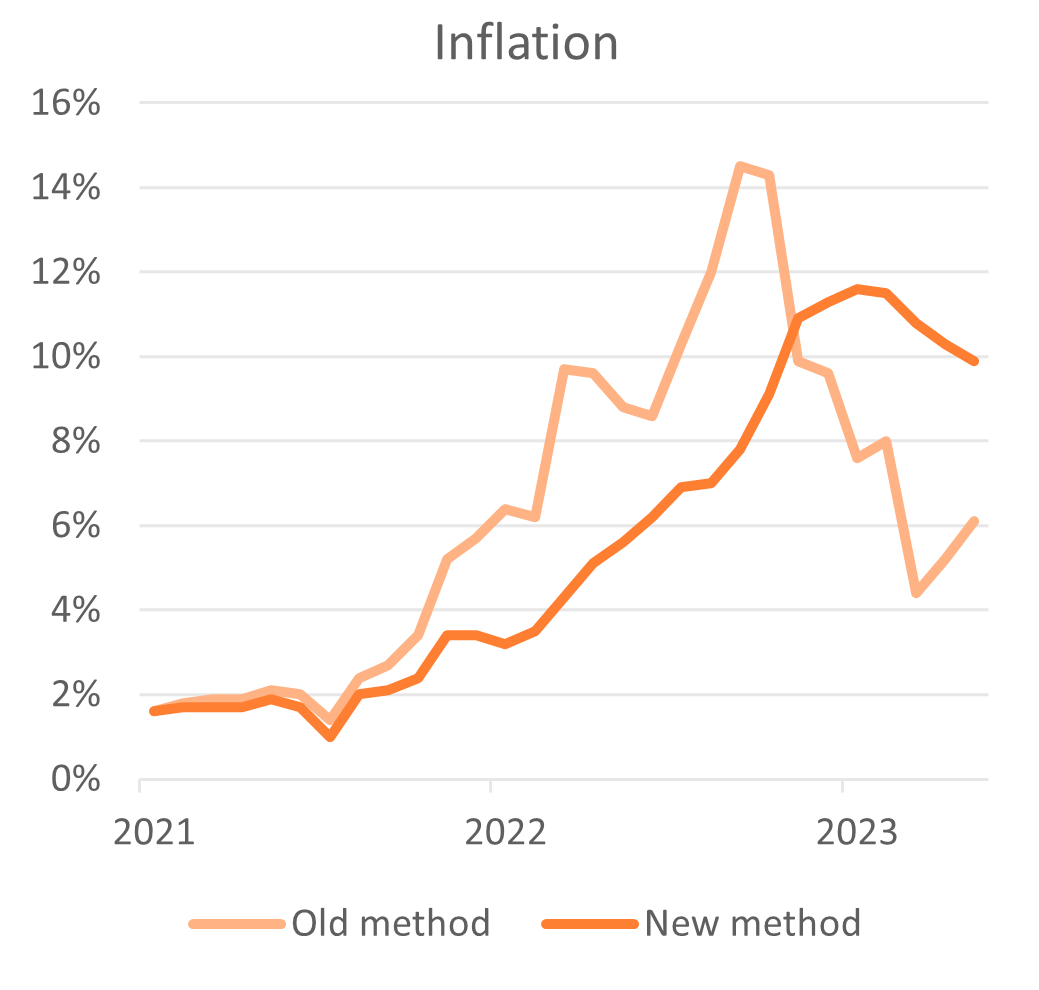
Inflation2 in the Netherlands dropped slightly to 5.7% YoY3, in June 2023, from 6.1% YoY in May 2023. Lower energy prices (-19.1% YoY) mainly drove the small decline. However, this was largely offset by higher prices of groceries (+12.6% YoY) and food (+13.1% YoY).

The high prices of food and groceries are due to higher costs for producers and suppliers. This is because companies still feeling the impact of high energy prices from a year ago as many companies operate under long-term energy contracts and cannot adjust their prices quickly. Additionally, staffing costs, mainly wages, have increased significantly.

As wages has risen significantly, prices tend to increase too, making it one of the reasons why core inflation is likely to stay high.     


Sentiment indicators

Overall consumer confidence4 fell to 61 at the end of Q2 2023 (-2-points QoQ), but improved on an annual basis (+11-points YoY). The overall level is based on economic sentiment, the propensity to buy, the economic and financial situation of households and whether it is a favorable time for major purchases.

While all indicators remain roughly the same as in the previous months, there is a clear improvement in almost all indicators compared to last year (apart from a favorable time to make major purchases).

Especially the view on the financial and economic situation for the next 12 months has improved significantly. The optimism about the future is probably due to less volatile interest rates, rising wages and falling inflation.             

Confidence in the housing market4 fell slightly to 72 at the end of Q2 2023 (-1-points QoQ and -15points YoY). The negative housing sentiment continues to be driven by higher mortgage rates (reducing borrowing capacity), declining house prices and general economic conditions.

Even though market sentiment is still negative, the confidence indicator has stabilised. This is most likely due to the first signs of house prices stabilising. In addition, higher incomes are improving borrowers' affordability.

Figure 1: Inflation in the Netherlands, end of June 2023 (Source: CBS)
Figure 2: Confidence indicators, end of June 2023  (Source: CBS & VEH)
Figure 2: Confidence indicators, end of June 2023 (Source: CBS & VEH)

Labour market

The Dutch labour market remains tight with an overall unemployment rate of 3.5% in Q2 2023 (-0.1% QoQ and +0.2% YoY), hereby providing a high degree of job security. The long-term unemployment rate is likely to stay low, as the population ages and the economy shifts from consuming goods to services. This means that the demand for labour is increasing for structural reasons.

The tight labour market compels employers to offer higher wages. According to the Dutch Central Bureau of Statistics (CBS), wage agreements rose by 5.7% in Q2 2023. Data from the Dutch employers' association (AWVN)  shows that in June 2023, wage agreements surged by 8.0%, exceeding inflation for the first time in a prolonged period.

The number of bankruptcies has increased for the third consecutive month. In June, three hundred companies filed for bankruptcy. This is twice the number registered in June 2022 (150). Over the first half of 2023, the number of companies filing for bankruptcy was 60% higher than a year ago. It is important to put this number in perspective, as the absolute number of bankruptcies in H1 2022 was at a historical low level. This was mainly due to the extensive support provided to companies during COVID. Now, companies are in the situation where support has ended, and support received must be repaid.

Figure 3: Number of transactions, end of June 2023 (Source: CBS & Land Registry)
Figure 2: Confidence indicators, end of June 2023  (Source: CBS & VEH)
Figure 2: Confidence indicators, end of June 2023 (Source: CBS & VEH)

Housing market

The housing market is showing mixed signals. On one hand, mortgage rates are stabilising and wages have risen, leading to an increase in the number of transactions. On the other hand, the outlook for future housing transactions has deteriorated as the construction sector faces problems and the housing shortage has increased significantly.


Transaction volume and housing supply

The number of transactions increased by 10% QoQ to 45,000 in Q2 2023. On an annual basis, the number of transactions fell by 6%. The market also declined on a 12-month rolling basis, with 186,000 transactions in Q2 2023 compared to 198,000 in Q2 2022 and 250,000 in Q2 2021.

The Dutch Association of Real Estate Brokers (NVM) reported that the number of houses for sale rose gradually to 32,000 in Q2 2023. Although, historically low, this was higher than the same quarter of the previous year, which had more than 25,000 houses for sale.

The market seems to have turned and gained momentum again, as shown by the increased number of transactions and supply of homes. However, the outlook for the number of transactions is still unfavourable. This is because of problems in the construction sector that cause delays in building new homes.      


The current state of the supply and demand dynamics is captured in the market tightness indicator. This indicator measures the ratio of the current number of houses offered for sale (supply) to the number of transactions (demand). The ratio dropped to 2.8 (-0.4-points QoQ) in Q2 2023, indicating that prospective buyers have an average of 2.8 houses on offer to choose from. The reason for the sharp decline in Q2 2023 is because the number of transactions increased more than the number of houses offered for sale.


New construction and housing shortage

The housing shortage in the Dutch housing market has worsened over the past year, according to ABF Research. The shortage rose sharply because the number of households in the Netherlands grew faster than expected (225,000 in 2023). This exceptional growth is due to I) refugees from Ukraine, II) older people living longer in their homes and III) smaller households. As a result, the housing shortage increased by 75,000 homes to a total of 390,000.

The growing housing shortage is not the only cause for concern. The number of homes to be built in the next period will be lower than forecasted because of the decline in new home construction. Higher interest rates, wage and material costs, expensive land, and nitrogen regulations have made it less attractive to invest in new constructions.

New home construction is expected to drop from over 74,000 in 2022 to 70,000 in 2023. It will decrease even further to 65,000 in 2024. The lower production is the result of a decline in the number of applied and granted building permits. During the first half of the year, only 25,000 permits were granted. Over a 12-month rolling period, the number of permits issued was only slightly above 50,000.


House prices

The house price index fell by 1.9% QoQ in Q2 2023 (and -5.2% YoY) according to the Land Registry. The downward trend is especially visible in the four largest cities (Amsterdam, Rotterdam, Utrecht and The Hague), while houses in other regions of the country are less affected. This is partly because large cities are more sensitive to international (economic) fluctuations, but also because of restrictions on rental housing and tax treatment.

Average house prices dropped from 417,000 euros in Q1 2023 to 406,000 euros in Q2 2023 in nominal terms. While the Land Registry reported a continuous decline in house prices, the NVM6  reported, after three consecutive quarters of decline, an increase in house prices from 395,000 to 410,000 in Q2 2023. The NVM typically registers a transaction two to three months before the Land Registry and is often used as an indicator for the Land Registry's future estimates.      

It is, therefore, imaginable that house prices may rise again. Especially now that the housing sentiment is stable, mortgage interest rates are no longer rising, and wages have increased significantly. Consequently, the affordability for homebuyers has stabilised in the past few months.

Another interesting aspect of recent house price developments is the effect of the property’s age. As energy consumption is an important driver, it appears that prices of older property' are decreasing, while prices for post-millennium properties are increasing. This is in particular the case for houses built till 1940.

The reason for this price differential is most likely because newer properties have, on average, a better energy rating and are (often) better maintained

Dutch housing and mortgage market Q2 2023

Mortgage market

Mortgage interest rates remained generally stable, keeping the mortgage market in a status quo with slightly more applications and therefore a higher mortgage volume. Besides that, borrowers continued to focus on shorter fixed-rate periods, while the porting option remains attractive.


Mortgage applications

The number of mortgage applications rose slightly in Q2 2023 (1.8% QoQ), continuing the trend from Q1. Although the increase is only marginal, it is a positive sign for the market. . Compared to the recent decline in December, where only 85,000 mortgages were registered, this is an QoQ increase of 9.2%. Despite the more optimistic trend in the first two quarters of 2023, the number of applications is still considerably lower than during the same period in 2022 (a decrease of 35%).

The Bank Lending Survey of the Dutch Central Bank (DNB), which solely focuses on the Dutch market, confirms the positive trend in the mortgage market. According to the survey, higher mortgage interest rates, weaker housing market prospects, and lower consumer confidence contributed negatively to the demand for home purchase loans compared to the previous year. In recent months, the market has been showing some signs of improvement, as mortgage rates are stable and wages are rising.

The mover option remains attractive for existing borrowers as current mortgage interest rates remain relatively high. Movers make up 12 to 14% of the market volume (excluding mortgage increases). The significant growth of movers in the market has a downside, as movers are inclined to stay with their current mortgage lender and do not enter the market at all. This makes them inaccessible to other lenders.


Number of originated mortgages and market volume

It usually takes a couple of months for the increase in mortgage applications to be fully reflected in the number of originated mortgages or market volume. That is because a mortgage application must be completed before the mortgage is issued and registered at the Land Registry. As the number of applications rose in both Q1 and Q2 2023, it is plausible that the number of originated mortgages and market volume will increase further in the coming months.

Following the trend of higher mortgage applications in the previous two quarters, the number of originated mortgages went up to 78,000 (+6.4% QoQ and -43% YoY) while the mortgage volume went up to 25 billion euros (+5.6% QoQ and -45% YoY).

Nonetheless, when compared to a year ago, both the number of originated mortgages and mortgage volume remain significantly lower.


Mortgage interest rates and spreads

The ECB raised its policy rates again, bringing the policy rate to 3.5% in Q2 20237. As (core) inflation persists, interest rates are expected to remain relatively high in the coming period, which may increase the likelihood of economic downturn and financial uncertainty. It is therefore uncertain whether the ECB will announce a further rate hike in the fall or instead decide to pause.

Despite the higher ECB policy rates, mortgage interest rates remained generally stable compared to levels of Q1 2023. The same trend is observed for the spreads on Dutch mortgages. Although mortgage spreads have generally been stable, they still outperform other LDI assets such as government bonds and have recovered from the dip in spreads in early 2022.

Dutch housing and mortgage market Q2 2023

Mortgage performance

The Dutch mortgage market performs very well, with low levels of losses and arrears. Furthermore, there are no indications of a significant rise in the number of losses or arrears. The Dutch National Credit Register (BKR) also noted a downward trend in losses and arrears.

To provide a projection of losses for the upcoming year in the Dutch mortgage market, public mortgage loan data (European Data Warehouse) is used as input for stress tests in Moody’s Portfolio Analyser. The stress tests are based on 4 macro scenarios as described below.

In all scenarios losses are expected to remain very low:

  1. The baseline scenario assumes that the economy experiences a period of stalled growth, with the economy suffering from the effects of the energy crisis combined with a rapid tightening of monetary policy. The labour market and supply-chain bottlenecks continue to normalise. The European Central Bank stops with tightening of policy rates in the summer and financial markets quickly calm down.
  2. The stronger near-term growth scenario assumes a strong recovery in both demand and supply. While demand is driven by households spending their excess savings in the service sector, supply is driven by productivity gains allowing output to expand quickly without causing higher inflation. In addition, improved confidence boosts consumption and business investment spending is above the baseline. The ECB temporarily raises policy rates slightly more than in the baseline, using the stronger-than-expected economic momentum to step up the fight against still-high inflation.
  3. The Moderate Recession scenario assumes that geopolitical tensions, triggered by the invasion of Ukraine but also between the US and China, escalate, leading to a sharp deterioration in European economic sentiment. Policy disagreements between the U.S. and China worsen, leading to further disruptions in supply chains, worsening shortages of manufactured goods and pushing up prices. The recession and the associated weakening of the medium-term inflation outlook led the ECB to end its tightening cycle.
  4. The Protracted Slump scenario assumes that geopolitical tensions and policy disagreements lead to a sharp deterioration in European economic sentiment and further disruptions in supply chains, worsening shortages of manufactured goods and pushing up prices. A prolonged period of low investment in innovative industries and human capital weighs on productivity growth, reducing the long-term level of GDP. Faced with a collapsing economy and rapidly slowing inflation, the ECB quickly reverses course and takes policy rates back into negative territory.


Number

Scenario

Arrears amount8

Expected loss9

1

Baseline

14.5bps

2.4bps

2

Stronger Near-Term Growth

14.3bps

2.4bps

3

Moderate Recession

15.9bps

2.6bps

4

Protracted Slump

17.1bps

2.8bps


First-time buyers in the Dutch mortgage market

The Dutch housing and mortgage market has changed significantly under the pressure of high inflation, rising (mortgage) interest rates and increased economic uncertainty. The period of record volumes and rising house prices has been replaced by a more accessible market for all types of borrowers, especially first-time buyers.

The Dutch central bank (DNB) reports that affordability in the Dutch housing market has improved. Meanwhile, first-time buyers have a better opportunity to enter the housing market due to rising wages and less competition, for example, from private investors. The Dutch mortgage network (HDN), which handles almost 80% of mortgage applications in the Dutch mortgage market, confirms that first-time buyers are increasingly entering the market now that the situation has improved.

In early 2023, two important regulatory changes were introduced that favoured first-time buyers in the market. The price ceiling for the transfer tax exemption was increased, and the cost limit for the National Mortgage Guarantee (NHG) was raised from €355,000 to €405,000. In addition, the NHG facilitates access to lower mortgage rates for buyers, which is in particularly attractive to first-time buyers.

Despite the improved position of first-time buyers, only 3.4% of the 4.5 million homes are affordable to them on a single income, according to a recent report by Calcasa. First-time buyers on two incomes are better off. In their case, 40% of the homes are affordable.

A closer look at first-time buyers shows that they tend to opt for 10- and 20-year mortgages, especially with NHG or fully financed (>90% LtV). Existing borrowers are more likely to opt for 10- and 20-year mortgages with 60 or 80% LtV.

The position of first-time buyers has finally improved and the number of first-time buyers on the housing market has increased. However, their situation remains challenging, especially as mortgage interest rates change and the housing shortage remains unresolved.

In the graphs below, the development of type of applicant is visualised10.

Dutch housing and mortgage market Q2 2023

New methodology Inflation CBS

In 2021, there was a sharp global rise in energy prices. The increase in energy prices had an immediate effect on the Consumer Price Index (CPI) of the Netherlands. Nevertheless, the CPI did not reflect the actual situation.

The methodology used by the CBS only included the prices of new energy contracts in its calculations. This exaggerated the actual inflation because most of the consumers had fixed their tariffs for a longer duration and had not yet noticed the higher prices.

CBS decided to change the methodology. In the old method, price development was measured based on new energy contracts. As of June 2023, CBS uses transaction data from energy suppliers. This data also considers the rates of long-term running energy contracts, hence providing a more accurate inflation figure.

The June 2023 CPI figures are calculated using the new method. The inflation for June 2023 is the difference between the CPI for June 2023 calculated using the new method and the CPI for June 2022 calculated using the old method. This indicates the presence of a 'method break12 ' in the inflation figure for June 2023. The methodological change will stay in effect until May 2024. May 2024 will be the final month where the inflation difference between the CPI calculated using the new method for energy prices (May 2024) and the CPI calculated using the old method (May 2023) is visible. Starting from June 2024, inflation will be determined solely by the CPI using the new method for energy prices.

The differences between the two methods are shown below. The key finding is that the new index increases less rapidly than the CPI but remains elevated even after the CPI starts declining.

Dutch housing and mortgage market Q2 2023

Annex I: Key indicators

Indicator

Q2 2022

Q3 2022

Q4 2022

Q1 2023

Q2 2023

Q-o-Q

Y-o-Y

Consumer confidence

50

41

48

61

61

0

11

Housing market confidence

87

83

73

73

72

-1

-15

General unemployment

3.3%

3.7%

3.6%

3.6%

3.5%

-0.1%

0.2%

Inflation

8.6%

14.5%

9.6%

4.4%

5.7%

1.3%

-2.9%

Mortgage applications

142,019

102,918

85,182

91,341

92,299

1.0%

-35.0%

Mortgage volume (in billions)

€45.60

€38.05

€30.81

€23.63

€24.96

5.6%

-45.3%

Number of originated mortgages

135,997

113,680

94,482

73,178

77,864

6.4%

-42.7%

House price index (2005=100)

175.85

176.88

172.66

169.944

166.75

-1.9%

-5.2%

Average purchase price

€429,010

€443,042

€415,546

€416,786

€406,547

-2.5%

-5.2%

Transactions

47,382

50,453

51,345

40,437

44,500

10.0%

-6.1%

ECB refinancing rate[1]

0.50%

1.25%

2.00%

3.00%

3.50%

0.5%

3.0%

10-year Dutch Government bond rate

1.74%

2.44%

2.82%

2.65%

2.74%

0.1%

1.0%

10-year German Government bond rate

1.37%

2.23%

2.50%

2.31%

2.35%

0.0%

1.0%

10 years mortgage interest rate

3.76%

4.49%

4.58%

4.27%

4.26%

-0.0%

0.5%

20 years mortgage interest rate

4.12%

4.54%

4.60%

4.37%

4.42%

0.1%

0.3%

30 years mortgage interest rate

4.25%

4.53%

4.69%

4.43%

4.52%

0.1%

0.3%

10 years mortgage spread

166

146

137

130

115

-15

-51

20 years mortgage spread

194

158

152

147

142

-5

-52

30 years mortgage spread

212

167

168

160

159

-1

-53


Indicator definitions

Indicator

Source

Definition

Unemployment

CBS

The number of people who are between 15 and 75 years old who are not in work but are actively searching for paid work and are directly available to work

Housing market confidence

VEH

A measure of confidence in the Dutch owner-occupied housing market or willingness to purchase a house

Consumer confidence

CBS

Percentage points of the total answers to the questions on the economic situation, the financial situation and whether now is the right time to make large purchases

GDP

CBS

The size of an economy by taking the sum of final uses of goods and services (final consumption/gross capital formation) plus exports and minus imports

House prices

CBS /Kadaster

All sales transactions recorded by Kadaster as well as the municipal valuation of all homes in the Netherlands

Housing shortage

ABF research

The difference between the outstanding demand for housing (demand side) and the available supply

Market share

Kadaster

The market shares of different lenders are determined, based on mortgage registrations provided by Kadaster

Transactions

Kadaster

Number of home sales registered by the Kadaster and conducted by a notary

Market tightness indicator

NVM

An approximation of the number of options that potential buyers have in the housing market.

The NVM covers approximately 75% of the market

Mortgage volume

Kadaster

The total annual mortgage turnover together with the total number of mortgages provided annually

Market share

Kadaster

The market shares of different lenders are determined, based on mortgage registrations provided by Kadaster

Newly built properties

CBS

Number of new constructions added to the existing stock, from the Key Register of Addresses and Buildings

granted permits

CBS

Number of granted building permits as documented in the Housing Act

Affordability

Calcasa

The percentage of the net monthly income spent on net housing costs

Mortgage spreads

DMFCO

The difference between the mortgage interest rate and the interest rate on a 7-year swap


1. The European Central Bank increased its policy rate by 25 basis points to 3.75% in August.

2. The Dutch Central Bureau of Statistics has introduced a new methodology. The description of the new approach can be found on page 11 of this document.

3. The data for July 2023 indicates a continued decrease in inflation to 4.6% year over year in the Netherlands.

4. The indicators range between 0 (negative) and 200 (positive). A value of 100 represents neutral.

5. The AWVN wage figure indicates the expected wage increases, over the next 12 months, for employees covered by the applicable collective agreement. The CBS collective agreement figures, computed periodically, reflect the implementation of collective agreements.

6. NVM is the largest association of real estate agents in the Netherlands, covering almost 70% of the Dutch housing market.

7. The European Central Bank increased its policy rate by 25 basis points to 3.75% in August.

8. This refers to the annualised probability of default, which applies to borrowers who are 90 days past due on their loan.

9. The expected annualised loss represents the total of all potential losses, multiplied by the probability of each loss occurring over a duration of 7 years (lifetime horizon).

10. In both graphs, the category 'other' has been removed for the sake of clarity.

11. The method break can result in a small statistical error, but it does not necessarily make the results unreliable.

Stay up to date

Would you like to stay informed about developments in the field of investing in Dutch mortgages? Sign up for our updates.

Wij gebruiken cookies om uw ervaring te verbeteren!